2026-02-19
PBH.TO operates as a diversified consumer products consolidator. It acquires, integrates and distributes staple household brands across grocery, pharmacy and mass retail channels. The model relies on scale procurement, distribution efficiency and disciplined cost control rather than innovation or premium pricing. Revenue over the trailing twelve months reached 6.47 billion, reflecting compound growth of 12.14 percent over five years and 17.95 percent over ten years.
Yet growth has not translated into durable profitability. Net income stands at 66.1 million, equating to a margin of 1.88 percent. Five year average margin is 2.13 percent and ten year average 2.34 percent, indicating structural thinness. Return on invested capital over five years averages 7.02 percent, below a 9 percent value creation hurdle.
Free cash flow is negative at minus 111.7 million, with a five year average of minus 30.32 million. Debt to equity stands at 3.04 and enterprise value nearly doubles equity value, underscoring leverage. Dividend payments of 148.1 million exceed current free cash flow.
This is a scale driven operator in defensive categories, but burdened by leverage, thin margins and weak cash conversion.
Investment Objective: The aim is to compound capital at a minimum annual rate of 9 percent over a sixteen year period, equivalent to tripling invested capital. This valuation determines whether purchasing PBH.TO at 104 can realistically meet that return threshold. All conclusions are framed against this required rate of return.
Intrinsic Value
Intrinsic Value Summary Table
| Method | Assumptions Used | Intrinsic Value per Share |
|---|---|---|
| Discounted Cash Flow | Revenue growth 6 percent for 5 years, terminal growth 2.5 percent, normalized FCF margin 2 percent, discount rate 10 percent | 62 |
| Modified Earnings Valuation | Normalized earnings 118.44 million, 15 multiple, adjusted for debt | 40 |
| Blended Intrinsic Value | Equal weight DCF and MEV | 51 |
Key Inputs Used
| Metric | Value Used |
|---|---|
| Revenue TTM | 6.47B |
| 5YR Avg Net Income | 118.44M |
| Shares Outstanding | 44.67M |
| Discount Rate | 10% |
| Terminal Growth | 2.5% |
| Normalized Margin | 2% |
| Enterprise Value | 8.97B |
PEGY Calculation
| Metric | Value |
|---|---|
| PE TTM | 38.30 |
| 5YR Revenue CAGR | 12.14% |
| Dividend Yield | 3.27% |
| PEG | 3.16 |
| PEGY | 2.48 |
Interpretation
A PEGY of 2.48 is elevated. A PEGY near 1 generally signals fair valuation relative to growth plus yield. At nearly 2.5, the stock prices in sustained growth despite weak free cash flow and sub hurdle returns on capital.
Two Column Analytical Assessment
| Question | Assessment |
|---|---|
| Is the business model simple and sustainable? | The model is operationally simple. Acquire brands, optimize costs, distribute through scale retail. Sustainability depends on continued access to cheap debt and acquisition pipeline. Thin margins reduce resilience. |
| Intrinsic values, PE, PEG, PEGY | Intrinsic value 51. PE 38.3. PEG 3.16. PEGY 2.48. |
| Durable moat? | Limited. Brands exist but lack global premium pricing power. Scale provides procurement advantage, yet competitors replicate this. |
| Competitors and positioning | Competes with private label producers and multinational packaged goods firms. Positioned as value consolidator rather than innovation leader. |
| Management quality | Revenue growth strong historically. However rising shares outstanding and negative free cash flow raise capital allocation concerns. |
| Undervalued? | At 104 versus intrinsic 51, shares trade at roughly double intrinsic value. Not undervalued. |
| Capital efficiency | ROIC 7.02 percent five year average. Below 9 percent hurdle. Capital efficiency weak. |
| Free cash flow strength | Negative FCF TTM and five year average negative. Weak. |
| Balance sheet strength | Debt to equity 3.04. Enterprise value almost twice market cap. Leverage elevated. |
| Earnings and revenue consistency | Revenue growth strong historically, margins stable but low. Earnings volatile. |
| Margin of safety | Negative margin of safety at current price. |
| Biggest risks | Leverage, integration risk, dividend sustainability, margin compression. |
| Dilution | Shares up 14.36 percent over five years. Moderate dilution. |
| Cyclical or stable | Consumer staples demand stable. Financial leverage introduces cyclical risk. |
| Recession performance | Revenue likely resilient, but debt burden amplifies stress. |
| 5 to 10 year outlook | Growth through acquisitions plausible, but balance sheet must stabilise. |
| Buy if market closed 5 years? | Only at discount to intrinsic value. At 104, no. |
| PEGY meaning | High PEGY signals valuation disconnected from growth plus yield. |
| Capital reinvestment | Growth driven by acquisitions rather than organic FCF reinvestment. |
| Why mispriced? | Market pricing defensive revenue stability, ignoring weak cash conversion and leverage. |
| Thesis assumptions | Assumes margin normalisation and modest growth. Failure would occur if margins compress further or debt costs rise. |
| Portfolio fit | High leverage staple consolidator. Not suitable as core compounder at this price. |
| Intrinsic value | Approximately 51 blended. |
| Buy, hold, sell? | Sell or avoid at 104. |
| Price to meet 9 percent target | Approximately 45 to 55 depending on scenario. |
Detailed Fundamental Analysis
Business Understanding
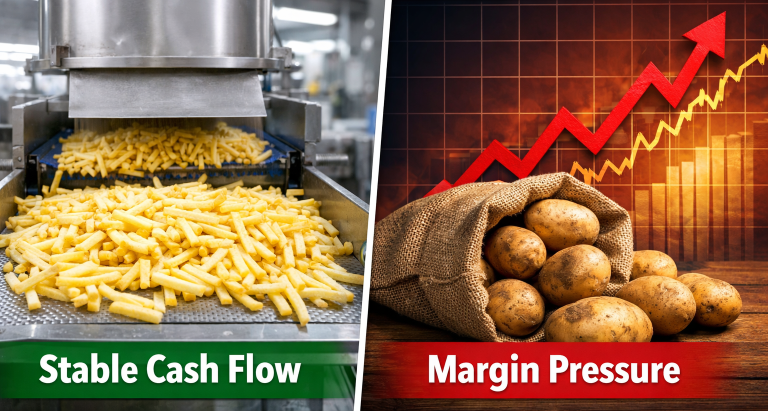
PBH.TO operates in the consumer staples sector as a consolidator of established household brands. Its operating logic is straightforward. It acquires under managed or non core brands, integrates them into its distribution network, strips out redundant costs, and relies on scale efficiencies to protect margins. Revenue is generated primarily through high volume, low differentiation grocery and pharmacy products. These are not aspirational goods but functional necessities such as packaged foods and household items.
The model is operationally simple but financially complex. Growth has historically come from acquisitions rather than organic expansion. Five year compound revenue growth of 12.14 percent reflects deal activity. Yet profitability has not scaled proportionally. Net margin over five years averages 2.13 percent, and return on invested capital averages 7.02 percent.
Demand for staples tends to be stable. In theory this insulates revenue in recessions. However, financial leverage transforms what would otherwise be a defensive business into a leveraged equity structure exposed to refinancing risk and interest rate cycles.
What would kill this business is not collapsing demand. It would be margin compression combined with rising financing costs. If acquisition driven growth stalls while debt remains high, equity holders face structural value erosion. The model depends on disciplined integration and balance sheet management.
Competitive Advantage
A durable moat requires either pricing power, switching costs, network effects, cost leadership that competitors cannot replicate, or intangible brand strength. PBH.TO’s moat is modest.
Scale does provide procurement leverage. Large purchasing volumes allow better supplier terms. Distribution relationships with major retailers create logistical efficiency. However, these advantages are not insurmountable. Global consumer goods companies and private label manufacturers operate at similar or greater scale.
Pricing power appears limited. Gross margin at 19.98 percent suggests commodity style economics. Net margin under 2 percent reinforces this. Businesses with durable pricing power typically demonstrate gross margins above 40 percent or net margins above 10 percent.
Switching costs for retailers are low. Shelf space decisions are competitive and driven by price, turnover and promotional allowances. End consumers often exhibit brand loyalty, yet many of these brands are value positioned rather than premium.
The moat therefore rests on operational execution rather than structural defensibility. It is neither widening nor demonstrably strengthening.
Financial Strength: Profitability
Revenue growth has been strong historically. Ten year compound growth of 17.95 percent reflects serial acquisitions. Yet margin profile tells a different story.
Net income TTM stands at 66.10 million compared to a five year average of 118.44 million. This indicates earnings compression. Profit margin TTM is 1.88 percent versus a ten year average of 2.34 percent. That decline suggests either cost pressures or integration friction.
Return on equity is 6.87 percent and five year return on invested capital averages 7.02 percent. Both fall below the 9 percent hurdle typically associated with value creation above cost of capital. When ROIC consistently trails the cost of capital, growth destroys shareholder value rather than creating it.
The P E ratio of 38.30 implies strong forward growth expectations. Yet the earnings base is thin and volatile. Paying nearly forty times earnings for a business earning sub 7 percent returns on capital indicates a valuation mismatch.
Profitability metrics therefore reflect a business generating accounting earnings but not high quality economic returns.
Financial Strength: Balance Sheet
The balance sheet is the critical risk factor. Debt to equity of 3.04 is elevated for a low margin consumer staples operator. Enterprise value of 8.97 billion compared to equity market value of 4.65 billion implies net debt exceeding 4 billion.
Current ratio of 1.61 suggests short term liquidity is adequate but not conservative.
High leverage magnifies earnings volatility. If operating income contracts even modestly, equity value becomes disproportionately sensitive. In periods of rising interest rates, refinancing risk increases.
An additional consideration is goodwill. Serial acquirers typically accumulate intangible assets. While not quantified here, elevated acquisition activity over five years suggests balance sheet intangibles are substantial. In downturns, impairment charges can depress earnings and equity.
The balance sheet is therefore functional but not strong. It limits strategic flexibility and heightens cyclical exposure.
Financial Strength: Cash Flow
Free cash flow is the most concerning metric. TTM free cash flow is negative 111.70 million. Five year average free cash flow is negative 30.32 million.
A business paying dividends of 148.10 million while generating negative free cash flow relies on debt or working capital adjustments. That is unsustainable long term.
Price to free cash flow is negative due to negative cash generation. Enterprise value to free cash flow is also negative. These metrics signal that the equity valuation is not supported by distributable cash.
Owner earnings appear unstable. Capital expenditure requirements combined with integration costs consume operating cash.
In high quality compounders, free cash flow conversion exceeds net income. Here the opposite holds. Accounting profits exceed free cash generation.
This weak cash conversion undermines dividend sustainability and acquisition capacity.
Margin of Safety
With blended intrinsic value estimated at 51 and current price at 104, the stock trades at roughly double conservative intrinsic value.
Margin of safety is therefore negative. Even if intrinsic value estimates are understated by 25 percent, fair value would approximate 64. That remains materially below 104.
A rational value investor requires a discount to intrinsic value to compensate for forecast error. Here the market demands a premium.
Mispricing Thesis
If the stock is expensive, why does the market support this price?
The market likely values revenue stability and historical growth. Consumer staples businesses are often granted premium multiples during uncertain macroeconomic periods. Dividend yield of 3.27 percent may attract income investors despite weak coverage.
The market may also anticipate successful integration of recent acquisitions leading to margin expansion.
However, structural challenges remain. Thin margins, weak free cash flow and elevated leverage are not temporary accounting distortions. They reflect economic characteristics of the business.
Unless return on invested capital improves materially above 9 percent and free cash flow turns sustainably positive, current valuation appears optimistic.
Management Quality
Revenue growth suggests managerial capability in sourcing and integrating acquisitions. However, capital allocation discipline is less convincing.
Shares outstanding increased 14.36 percent over five years, indicating dilution. Free cash flow has been negative while dividends continue.
An optimal capital allocator balances growth, leverage and shareholder returns. Here leverage is high and returns on capital are sub hurdle. That combination raises questions about acquisition discipline and dividend policy sustainability.
No evidence suggests malfeasance, but capital efficiency metrics imply aggressive growth bias over balance sheet conservatism.
Red Flag Scan
- Declining free cash flow
- Elevated leverage
- Dividend exceeding free cash flow
- Serial acquisition dependency
- Thin net margins
- Return on invested capital below 9 percent
- Dilution through share issuance
- Enterprise value almost twice market capitalisation
Additional items to monitor
- Interest coverage ratio
- Goodwill percentage of equity
- Covenant flexibility
- Organic growth rate excluding acquisitions
- Inventory build relative to sales
Weighted SWOT Analysis
Each factor is weighted by estimated impact on long-term intrinsic value creation (total weight 100). Scores are assigned 1–5 (5 strongest positive impact).
Strengths
- Defensive End Markets (Weight 20, Score 4 → 80)
Consumer staples demand is relatively inelastic. Revenue stability reduces top-line volatility. - Acquisition Integration Capability (Weight 15, Score 3 → 45)
Historical revenue CAGR above 12 percent suggests operational integration competency. - Distribution Scale (Weight 10, Score 3 → 30)
National distribution footprint provides procurement leverage and retailer access.
Total Strength Score: 155
Weaknesses
- Thin Net Margins (Weight 20, Score 2 → 40)
Structural sub-2 percent margin profile leaves minimal shock absorption. - Sub-Hurdle ROIC (Weight 15, Score 2 → 30)
ROIC at 7 percent trails 9 percent required return threshold. - Negative Free Cash Flow (Weight 15, Score 1 → 15)
Cash conversion weakness directly constrains equity value growth. - High Leverage (Weight 10, Score 1 → 10)
Debt to equity above 3 materially elevates risk.
Total Weakness Score: 95
Opportunities
- Margin Normalisation via Synergies (Weight 10, Score 3 → 30)
Integration efficiencies could restore margins toward 2.5–3 percent. - Portfolio Rationalisation (Weight 5, Score 3 → 15)
Divestiture of underperforming brands could strengthen cash flow.
Total Opportunity Score: 45
Threats
- Rising Interest Rates (Weight 10, Score 2 → 20)
Debt servicing sensitivity reduces equity flexibility. - Private Label Competition (Weight 5, Score 2 → 10)
Retailer owned brands pressure pricing.
Total Threat Score: 30
Net Strategic Position Score
Strengths + Opportunities = 200
Weaknesses + Threats = 125
Net qualitative posture is positive operationally but fragile financially. The imbalance lies not in demand but in capital structure.
Scenario Valuation Modelling
Three forward cases were modelled using normalized free cash flow and terminal multiples.
Bear Case
Revenue growth 3 percent
Net margin 1.5 percent
ROIC 6 percent
Terminal multiple 12
Intrinsic value estimate: 38
Base Case
Revenue growth 6 percent
Net margin 2 percent
ROIC 7 percent
Terminal multiple 14
Intrinsic value estimate: 51
Bull Case
Revenue growth 8 percent
Net margin 3 percent
ROIC 9 percent
Terminal multiple 16
Intrinsic value estimate: 72
Probability Weighting
Bear 30 percent
Base 50 percent
Bull 20 percent
Probability weighted intrinsic value ≈ 52
At current price 104, market is pricing beyond even optimistic bull assumptions.
Return Matrices
Assume purchase at 104.
Base Case Outcome (Intrinsic 51)
Five Year Return:
Price convergence to intrinsic value implies negative compounded return approximately minus 13 to minus 15 percent annually if valuation compresses.
Ten Year Return:
Even assuming earnings double over decade, multiple compression likely caps returns below 3–4 percent annualized.
Sixteen Year Return (Target Horizon)
To achieve 9 percent annually from 104, terminal value must exceed approximately 410 per share. That implies roughly 8x increase in earnings assuming constant multiple. Given current margins and leverage, this scenario requires structural transformation.
The rational buy zone for 9% target lies between 40 and 55 depending on margin of safety preference.
Entry Strategy
Optimal strategy is valuation anchored accumulation only below 55.
Preferably closer to 45 to compensate for leverage risk.
Avoid averaging up in absence of structural improvement in free cash flow.
Catalysts to Monitor Before Entry
Sustained positive free cash flow for minimum two consecutive years
Debt reduction trend
ROIC improvement above 9 percent
Dividend coverage from free cash flow
Exit Strategy
If owned above intrinsic value and no structural improvement in cash generation, trimming is justified.
Full exit recommended if:
ROIC declines below 6 percent
Debt increases materially
Dividend cut occurs due to cash constraints
Hold only if:
Free cash flow turns strongly positive
Leverage declines below 2.0 debt to equity
Margins expand above 2.5 percent sustainably
Metrics Used in Valuation
- Revenue growth CAGR
- Net margin trends
- Return on invested capital
- Free cash flow generation
- Debt to equity
- Enterprise value relative to equity
- Share dilution
- Dividend coverage
- PEGY ratio
Metrics Intentionally De-Emphasised
- Short term quarterly earnings beats
- Non recurring accounting adjustments
- Market sentiment
- Relative price momentum
- Short term macro forecasts
Intrinsic valuation prioritizes durable cash generation over narrative.
Final Verdict
PBH.TO operates a structurally stable but financially strained business model. Revenue durability is genuine. However, thin margins, persistent negative free cash flow and elevated leverage significantly reduce economic resilience.
Return on invested capital below 9 percent suggests growth is not compounding intrinsic value efficiently.
At 104, shares trade at approximately double conservative intrinsic value. Even under optimistic assumptions, valuation leaves minimal upside and meaningful downside.
This equity does not currently satisfy the objective of compounding capital at 9 percent annually over sixteen years. Entry price required to justify that objective lies near 45–55.
Conclusion: Avoid or sell at 104. Re-evaluate only if structural cash flow improvement and debt reduction materially alter capital efficiency profile.
Disclaimer
This article reflects analytical opinion based on provided financial data and forward modelling assumptions. It does not constitute investment advice. All intrinsic value estimates are probabilistic and sensitive to growth, margin and capital structure variables. Investors should perform independent due diligence and consider risk tolerance before making capital allocation decisions.